ArcGIS Desktop

Top 5 differences between ArcMap and ArcGIS Pro

Top 5 differences between ArcMap and ArcGIS Pro

Are you an occasional Esri software user that is needing to ramp up your game?  Maybe its been a couple of years since you dabbled with the GIS software and you have a project that needs a little geospatial touch.  One of the questions you may find yourself asking is "What is the difference between ArcMap and ArcGIS Pro"? 

Building a Hoops Tracker App with ArcGIS Solutions is a Three-Point Play

Building a Hoops Tracker App with ArcGIS Solutions is a Three-Point Play

Hoops Tracker is a Esri Story Map that displays information for the 2018 Class 1A and 2A Boys Basketball Tournaments in separate web mapping applications, paired with a view of IHSA's interactive ScoreZone web page and other IHSA links.

Three Parcel Fabric Tricks that Will Save you Time

Three Parcel Fabric Tricks that Will Save you Time

Here are a few brief time-saving tips when performing parcel map maintenance tasks within Esri's parcel fabric.  You can find all of our ArcGIS parcel mapping tips and tricks by signing up at cloudpointgeo.com/parcelfabric.  For more information about migrating your data to the parcel fabric..

Three New Technical Certifications

Three New Technical Certifications

Cloudpoint Geographics Inc. is proud to announce that Paul Stephenson, Matt Junker and Micah Williamson have all recently been awarded Esri Technical Certification which recognizes superior skill levels utilizing Esri’s software for geographic information systems (GIS). Paul and Matt were awarded the ArcGIS Desktop Associate Certification. Micah was awarded the Enterprise System Design Associate...

A Few Reasons for Pro

A Few Reasons for Pro

A fresh calendar year is upon us, and one of my goals this round is to give ArcGIS Pro a legitimate shot at being the go-to desktop GIS application. (TBD...)

As increasingly more development goes into ArcGIS Pro, we as GIS professionals are beginning to actually consider the gradual shift away from ArcMap. Many of us have dabbled with Pro by now, and many of us have been more or less disappointed by either our machines’ lack of drawing performance or the program's lack of familiar places or functions.

All of Illinois Geocaches in One Map*

All of Illinois Geocaches in One Map*

I work for a living, but in the off times I still play with this technology, so I have a Premium Geocaching subscription. This allows me to query their data in circular buffers and return a GPX file. After about 27 of these queries, I was confident that I had all of the cache locations I wanted. Running a few geoprocessing functions, I dropped any duplicates and union-ed these points to county polygons to get the number within each county. This data are reflected in the Classified inset map. What am I talking about? Geocaching of course. If you're reading this tech blog there's a pretty good chance you already know what geocaching is... 

Cleaning up the Waste with Optimized Routes!

Ever wonder if that route you run every day is the most efficient?  Looking back, it all started when you found a map, grabbed your highlighter, marked it up and Voilà!  From that day forth, your agency's routes were set in stone and they've been traveled over and over and over again ever since.   You know that route like the back of your hand and of course its the most efficient because after all, you came up with it! 

Well now with GIS tools such as ArcGIS Network Analyst for optimizing routes with the Vehicle Routing Problem Solver you may find that your old highlighted map is costing you lots of money in wasted fuel, time, and equipment ware.  This post will take a brief look at the process optimizing routes for solid waste and recycle collection.

Step 1. Obtain point features for pickup locations

Garbage or recycle bins are located with GPS or geocoding methods and loaded into the GIS as point features to represent the various stops along routes.  In this case the pickup locations were condensed to one point per street segment to allow …

Garbage or recycle bins are located with GPS or geocoding methods and loaded into the GIS as point features to represent the various stops along routes.  In this case the pickup locations were condensed to one point per street segment to allow for more efficient processing within the ArcGIS Desktop software.

Step 2. Generate Orders for Routing (condense if needed)

Creating optimized routes for thousands of pickups can take a considerable amount of time to process even with the latest hardware. For this example we used GP tools such as Create Route Event Layer and Generate Near Table to condense points along r…

Creating optimized routes for thousands of pickups can take a considerable amount of time to process even with the latest hardware. For this example we used GP tools such as Create Route Event Layer and Generate Near Table to condense points along road segments and determine right or left side of street.  This also allows for the pickup quantity field in the Orders class to be used as the number of cans along that side of the street.  During this phase you will also place your 'depots' (starting and ending locations, including renewal locations such as landfills) on the map.


Step 3. Model Existing Collection Routes

By creating models of the existing collection routes within the GIS, we can confirm that variables such as travel times and service times are actually giving us "real-world" conditions and will provide credible results in our proposed routing models…

By creating models of the existing collection routes within the GIS, we can confirm that variables such as travel times and service times are actually giving us "real-world" conditions and will provide credible results in our proposed routing models.  Here we can see that the existing routes are very "block-like" and cleanly divided by neighborhood or subdivision.  Looks pretty but not necessarily 'optimized'.

Step 4. Adjust Orders (pickup locations)

You may need to manually adjust some order locations and attributes as a result of modeling the existing routes to make sure the data is accurate and providing expected results with proper sequence of stops for the given route.

You may need to manually adjust some order locations and attributes as a result of modeling the existing routes to make sure the data is accurate and providing expected results with proper sequence of stops for the given route.

Step 5. Evaluate Various Scenarios and Select Optimized Routes

When processing the new routes, select various scenarios and compare those results to the existing routes to identify cost savings.  For example, if the current collection program is running seven (7) trucks, try running a proposed model with o…

When processing the new routes, select various scenarios and compare those results to the existing routes to identify cost savings.  For example, if the current collection program is running seven (7) trucks, try running a proposed model with only six (6) trucks and compare results.  Cost saving measures are usually identified by total time or total distance.  Once optimal routes have been selected, you will want to drive those routes as a quality assurance measure to be sure they are modeled accurately from the provided street network data.

Step 6. Using the Results

ArcGIS Network Analyst can generate turn-by-turn directions with detailed information on stops and estimated arrival and departure times.  This information can be distributed to the drivers or entered into a GPS guidance applications such as Navigator for ArcGIS which will soon allow users to utilize their own pre-defined routes from ArcGIS Desktop or Online.

For more information or for a free quotation on optimizing routes for solid waste collection please contact Jon at 877-377-8124.

Using ArcGIS Pro on a MacBook Pro

Pro on Pro (on Pro)

I've committed to learning Esri's ArcGIS Pro. Problem is, I use a Apple MacBook as my primary GIS machine and most software from Esri only runs on Windows. Up to this point, this is no big deal because ArcMap is 32-bit and not very memory intensive. It's been running on Parallels for Mac just fine for 2 1/2 years. Things change. 

ArcGIS Pro Running on Parallels for Mac in 3D

I had played with the Beta a while ago, and it didn't run too well on my current system. The display flickered & stuttered quite a lot and seemed to be constantly loading something. In anticipation for full release of ArcGIS Pro v1.0, I upgraded to the most current version of Parallels (10) and doubled my RAM to 16GB. Unfortunately, these easy answers didn't help with the display, I was still getting jumpy navigation and 3D felt like it was on Windows 2000. Great. Felt like i just blew $200 in upgrades. :-/

Last week during the Esri Business Partner Conference I spoke to a few virtualization experts who were demonstrating  ArcGIS Pro on a virtual machine. (it seemed like they were there waiting just for me!) We spoke about my set up, there was a bit of nose-wrinkling but I looked around and pointed out about a dozen or so Macs throughout the Expo center. You have to do this when you talk about Esri software running on a Mac. Do I even need top point out how Apple was the only PC maker to have double digit growth in the past year?  Point is there will be a lot of people trying to figure out how to run ArcGIS Pro on their MacBooks and the folks at the conference helped me out so I pass along that info to you: 

Very UnOfficial Benchmark Testing In ArcGIS Pro in Parallels and VMware Fusion
  • Don't use open source virtualization. Virtual Box is nice if you aren't doing anything serious but doesn't have the options or horsepower that a production machine requires. VM Ware Fusion and Parallels are virtually identical in benchmark testing with ArcGIS Pro. 
  • Do upgrade your RAM. I moved from 8 to 16 and dedicate a full 8 GB to my virtual machine. Parallels allows me do shave off another 2GB to the Video Memory still leaving 6 GB to run the MacBook. 
  • Do use DirectX9 instead of 10. I know this is counterintuitive but the virtualization experts told me that ArcGIS Pro uses DirectX11 by default if it's available then jumps down to DirectX9. There is some compatibility issue with DirectX10. Parallels has options for OpenGL, DirectX10 and DirectX9. My video stuttering problems STOPPED when I chose DirectX9. 
  • Do change ArcGIS Pro Display Options. Go ahead and monkey with the settings a little. Make sure your 3D accelerator matches your VM host. Enable Vertical Synchronization, and test the Speed --|-- Quality slider. I also set my system to delete the cache after I close the project. 
  • Do use a host machine with a Nvidia Graphics card. MacBooks with Retina displays usually have one of these but you can check to make sure. Unfortunately, I do not. Download the 'Clear Sailing' Nvidia demo to test your system. 


Final Notes:

Every system is a bit different. ArcGIS Pro is programmed to use a GPU if it's available. My Expert friends inform me that VMware Fusion leverages the GPU for 3D acceleration, but does not support GPU true pass-through. Parallels tries to create a virtual GPU by assigning RAM directly to 3D acceleration but it's not a direct GPU either. Look for this technology to keep advancing. I an a firm believer in SSD drives. I have two right now, one is completely for the Windows VM. 


Disc Golf

This started out as a simple smartphone GPS(GPX) trace. A trace to follow the route through a local course, which I could later add to my own map. Of course that map had to include the beginning and ending for each hole – tees and baskets. Nice! And easy! …Hmmm maybe way too easy. Decided to digitize the surroundings in ArcGIS for Desktop to really make the course stand out. Some of the data was available, but most of it did not meet the quality standards I was after – so I ended up becoming super-efficient at a variety of digitizing techniques instead. Note: I did and still do turn to Google Maps for reference in their top-gun imagery. In your face, everyone else’s imagery.

The first result was not bad, and caught the attention of the right people at the right time. It just so happened that a prominent local tournament could use such mapping for a few area courses. Sweet.

The first course, fairly refined. Washington Park, Washington IL

It's been great so far. Courses are a nice size for weekend projects, and contain a good variety of features to work with. Oddly enough, what I consider the biggest challenge to date has been depicting trees. When canopy is sparse, you can drop points to represent trees and shrubs, but that gets to be tedious rather quickly. And finding the best way to get those points to display at a quasi-relative circumference can also be WMTTD (Way More Tedious Than Desired).  Other options used include tracing the boundary of thick canopy areas or my favorite, extracting them from DSM (takes a billion mouse-clicks off your finger, but you still spend enough trial and error time finding that perfect set of values that your default gdb looks like its ten years old).

Sneak peak of the temporary course at Eureka Lake Park, Eureka IL

No matter what methods have been used, a number of new tricks were picked up along the way that fulfilled certain needs and have made for easier going moving forward (hooray GIS). This has been a great example of utilizing the technology for a practical use while coupling it with an enjoyable pastime. Not to mention it will help in a small way to contribute to both the disc golf and local communities. Win-Win.

ArcGIS Pro Demo-nado

OK. The GIS World has had the much anticipated ArcGIS Pro for about 3 months now, and everyone is still using ArcMap. Why? Because change is hard. 

Geo-Professionals should really change that, because ArcPro, Pro, ArcGIS Pro, AGP whatever-we-call-it is actually a pretty good product. YES, it has some shortcomings, as most first versions do. However, in a very unofficial tally from a group of 12 GIS professionals, the good outweighed the bad 8-5. Not a blowout be any means, but a positive result nonetheless. 

It's no surprise that we (Cloudpoint) are behind the product. Ok, I am. I recently doubled my RAM in may MacBook in-part to be able to devote more speed to Parallels to run ArcPro. It runs well too! Drawing does slightly stutter when in 3D but that doesn't matter because I have yet to be convinced that my clients want or need 3D GIS.

I digress. This morning I created the two videos below in order to demonstrate ArcGIS Pro and several of it's best qualities (not 3D). The videos are fast paced, packed full and I kept them between 6 & 7 minutes. This is not GIS training, you can't train any person GIS in 7 minutes, let alone on a new piece of software.  I hope you enjoy them and then download your copy of Pro to try it out. 


  • In this first video of a two-part series, We simply walk around the interface and perform some SIMPLE actions. Opening a Map, Editing map notes and understanding what happens.


  • In this Second video of a two-part series, we will talk about importing an ArcMap MXD, Editing and touch briefly on navigating layouts. 

Please leave a comment on YouTube if you like it. 

10 Reasons to migrate to the Parcel Fabric

As many of you know, the parcel fabric concept has been around for quite some time but many have been slow or hesitant to adapt to it.  In this entry, we would like to take a brief look at some of the advantages of using the fabric and try to answer some questions such as "Why should I migrate to the parcel fabric?" or "What real benefit will I receive from an ArcGIS solution for maintaining parcels?".  If you haven't already done so, chances are you will soon be taking a serious look at what it takes for you to migrate your polygon parcels into this model.

1. It's A platform solution- One of the clear advantages of having a platform solution is that you don't have multiple vendors supplying multiple solutions.  You already use the ArcGIS platform and pay a healthy maintenance subscription so why not take full advantage of the dollars you have invested in your COTS (commercial-off-the-shelf) solution.  You will not only save money from that end but there is a good chance you will be on the same page as your neighboring agency.

2. Everything is tied together-  If you have been maintaining your parcels in a simple polygon layer you have undoubtedly found times when you have overlap in your polygons.  This can cause many frustrations when editing and not to mention the spatial inaccuracies that come along with it.  The fabric avoids overlaps by allowing your parcels and boundary lines to "move" all together.  Instead of adjusting 4 different polygons when a corner point moves, why not tied it together so you only make one change everything else adjusts to that change.  The fabric allows you to make these adjustments with ease saving you time and money.

3. The Parcel Editor Toolbar- esri has the parcel editor toolbar available as a free add-in that contains multiple tools and menu commands that help simplify the workflows involved with maintaining parcels and control points.

The Parcel Editor Toolbar helps bring the fabric to life

4. Parcel Workflows- The Parcel Editor Toolbar also contains a menu for automating parcel editing workflows.  Merging parcels, splits, subdivisions, imports from CAD, and boundary line adjustments are all made easier using these workflows.

A screen shot of esir's Tax Parcel Editing Map template

5. Tax Parcel Editing Map- All of the parcel types, whether, tax parcels, subdivisions, lots, or encumbrances (also known as easements) are stored in the fabric as one feature class, however they are separated by types and layers in a sample map you can download know as the Tax Parcel Editing Map.


6. The Plan Directory- Another freebee built into the parcel fabric data model is a table for storing information about record drawings, plans, survey plats, or other legal documents used by surveyors and engineers to describe their findings.  This related table allows for user-friendly entry and interaction with the plan's corresponding parcels to store information such as Name of Surveyor, Survey Date, Document/Plan Numbers, etc.  You can create and maintain plan record information for each parcel or subdivision within the fabric or take it one step further and link the source document directly to the GIS.

7. Spatial Accuracy- You might be telling yourself "I really don't need survey accuracy for my parcels" but with each control point you add to the fabric, whether from the City/Town, County, Private Surveyor, or Federal sources; it allows you to refine and adjust your parcel fabric for greater spatial accuracy.  Its not uncommon to adjust your fabric over time and achieve spatial accuracies down to just a few inches or less with respect to the real world. 

The historic parcel layer helps keep a record of past changes and is automated from the workflows.

The historic parcel layer helps keep a record of past changes and is automated from the workflows.

8. Historical Parcels- Many times we hear of the need to go back and look at what the parcel ID's or layout prior to a split or annexation.  The parcel fabric has a layer specifically designed to maintain the historical parcels and the great thing is that its completely automated.  When you step through the workflows it will prompt you if you want to create historic parcels from your new changes and by doing so it keeps a well documented history of your land records.

9. Local Government Information Model (LGIM)- The fabric allows you to enable information models such as the LGIM which many are already using.  This may save you a lot of time up front so you don't have to 're-invent the wheel' providing out-of-the-box tools for working and interacting with your other land record data layers.

Here is a parcel that has been subdivided into lots and easements including drainage, utility, and ingress/egress.

Here is a parcel that has been subdivided into lots and easements including drainage, utility, and ingress/egress.

10. Standardization- Isn't it nice when we are all on the same page and speaking the same language.  Using the parcel fabric allows us to have a consistent form of naming convention and storing data to help when we are interacting with our 'neighbors' or as GIS users or managers transition in and out of jobs its nice to have familiar data formats to build upon.

As you continue to expand your use of GIS technology, I hope you will find the parcel fabric as a very useful tool for maintaining land records in a clean and simplified format.  We will be discussing the process of migrating your data to the parcel fabric and explain some "do's and don'ts" in an upcoming post.

Rochelle Municipal Utilities: Zero to Hero

Let me lead off by stating the obvious, This project is not complete!!! We've invested a lot of time and energy into RMU and when we were asked to write a summary of where GIS has brought them in the past year, I jumped at the chance and wanted to post it here as well. The Following article has been circulated around their various committees and councils and so we present it here. 

1402517536505.png

In June of 2013, Rochelle Municipal Utilities Electric Department moved forward in several significant ways to become more efficient in the use of Geographic Information Systems (GIS) They invested in a three-year Enterprise License Agreement (ELA) from Esri Inc. of Redlands, CA for their GIS software package.  This license agreement allows RMU to utilize any and all of the industry-leading Esri software site-wide, as-needed. In conjunction with this agreement RMU purchased a high-end server environment for implementing this software. As well, they 

“Putting our Electrical Depa-rtment records into a GIS has allowed us to communicate more efficiently with office and field staff.”

— Al Corl, Electric Dept. CAD Supervisor

entered into a contractual agreement with Cloudpoint Geographics Inc. of Roanoke, Illinois for set-up and geospatial consultation services. 

Previously all of the Department’s spatial data was stored in AutoDesk CAD format. While accurate and exceptionally maintained, the CAD data was housed on local workstation hard drives. Disseminating the data was complex and not easily achieved. 

Seinor staff understood the benefits of utilizing a central GIS available to the entire staff. As well, they had the insight to select a database structure that was open and standardized rather than closed source or proprietary. RMU’s chosen geospatial consultant, Cloudpoint, had experience with both the Multi-Speak and Local Government information models.  

After several planning meetings and explanation of system-specific terms, the CAD vector data geometry was able to be imported into the Multi-Speak model using the same Esri software that RMU had purchased. In order to insure completeness and accuracy, electric department staff had open and frequent updates and conversation with Cloudpoint. Every attempt was made to keep the data as intuitive and close to the previously used CAD naming conventions as possible while still adhering to standards of an open information model. 

During the same time as this CAD to GIS data conversion, Esri server software (ArcGIS Server) was installed on a dedicated web server for internal use. In the course of this first phase of deployment the intension of staff was to keep the digital infrastructure private to a select group of RMU personnel familiar with the data. However, the software technology was installed and configured with the ultimate goal of deploying the map services as the final product out in the field in a connected tablet environment. 

Even though the Electric Department’s data was an obvious priority, some attention and time was paid to development of other basemap layers. RMU had participated for years in the Ogle County GIS consortium without realizing the full potential and usefulness of that group’s data offerings. Inserting these datasets into the local government model allowed RMU to grasp a fuller picture of their complete GIS eco-system.  

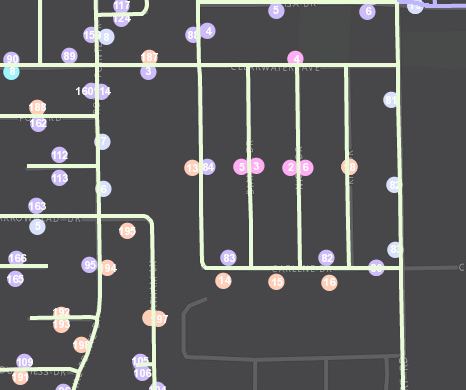
Along with their meticulous CAD drawing, electric department staff had collected over 22,000 photos of their 7,286 electric poles. These data, while extremely useful, was only available on one PC within the electric department offices. Again, with the intension of eventually pushing this information out to field personnel, Cloudpoint moved these photos into the cloud. Because of the foresight of RMU staff and the naming of these 22,000+ photos, a linkage could be drawn from the poles feature class to the images themselves while on a protected and redundant  webserver within Amazon Web Services S3 storage. This link is currently being used on the desktop as well as in the field. 

Internally to the RMU network, there are currently only a few editors of the electrical GIS layers.  While this seems inefficient it actually is an industry-wide ‘Best practice’. Using Esri server-side software (ArcSDE) riding on-top of Microsoft Sequel Server the electric data is currently a protected enterprise dataset. This means that though many have access to see the authoritative data, only a select and qualified few have access to change it. These different versions of the data are synchronized after the author approves the edits. This reconcile and post process can be done on the GIS server by qualified staff. 

During the continued database development stage, sharing was done via ArcMap and a set of shared folders and File Geodatabases. This full-featured software program from Esri has a high learning curve. In order to completely “see” the same layers, users needed to be proficient enough to create layer files, change symbology and then save pathnames as relative or UNC path types. This potential road bump was avoided by utilizing maps created by ArcGIS Online  and disseminating the information via secured webmaps. 

This large step forward allowed the electrical department field crews to use hand-held tablets to see map images & data, aerial imagery, address locations, pole photos, as well as PDF manuals of their departmental standards. RMU purchased four - Apple iPads equipped with 4G LTE and enrolled them in a Cisco Mobile Device Management software solution for protection and accountability.  While this is not an Automatic Vehicle Location (AVL) solution, it speeds up response time and efficiency of truck crews by being able to know what they need to replace before ever ever arriving on site. 

The ease of access this allowed garnered a welcomed reception from the field crews and sparked a desire to have more complete and faster updates. This step required the involvement of RMU IT staff to push the previously mentioned map service as provided by ArcGIS Server out to a secured location on the web. In order to effectively and safely open a port in a network’s firewall, many precautions needed to be adhered to. This implementation is no different. Cloudpoint worked with RMU staff as the translator between GIS terminology and their network to achieve both security and speed requirements. This effort was reinforced by RMU with the forward thinking purchasing of quality hardware and an ELA from Esri nearly a year prior. 

Currently, GIS in Rochelle Municipal Utilities Electric Department is in full swing. Edits to the system are changed internally and pushed out to the field crews almost instantaneously. Field personnel have a customized mapping interface that was created with several iterations and face-to-face meetings. As well, field crews can close the feedback loop by highlighting areas that are incorrect (including attaching pictures) or changing attributes of specific features within the map on their tablets. These edits are again propagated back to the office and, if approved, incorporated into the default database version. 

The GIS is not, and will never be, completely done. RMU senior staff understands that in creating these efficiencies, there will be  perpetual training and maintenance of the system. Software updates will be needed, new layers created, deployments to be made, etc… It is a dynamic infrastructure just like the electrical system that it represents. They also understand the significance of how far they have come in one short year.