

When mobile data collection takes place, there are multiple ways of consuming that data once it’s been collected. Through the use of Dashboards, Web Apps & Maps, and even through desktop applications like ArcGIS Pro, data can be viewed, queried, edited, etc. However, there could be certain data collection workflows in which real-time notifications would be useful to notify other workers, or members of that organization. For example, if I were adding features in the field to a “City Code Violations” hosted feature layer through Field Maps, I could use a process in the feature’s pop-up to trigger an email to be sent to other users in my organization to notify them of the new violation feature I just created. Follow the steps listed below to implement this process in you organization!
Survey123: Automate Data Entry with JavaScript Queries!

One of the main benefits of utilizing Esri’s Survey123 application within your organization, is that it is a very powerful data collection tool. Survey123 can be utilized to collect data on just about anything and everything, and the purpose of the form will vary greatly depending upon what kind of data is to be collected. Regardless of what the end purpose of the survey form is, the best way to ensure data integrity and to streamline the data entry process is to have functionality built into your survey forms themselves to assist the end user! In this blog post, we’re going to be looking at how using an JavaScript query can automate the input of data by auto-populating fields in the survey form based on entering the ID of a specific fire hydrant.
Using ArcGIS Online to Perform Inspections and Analyze PCI Ratings

Esri provides a vast number of resources and applications that enables their users to collect, update, and analyze their asset management data. In this blog post, we’ll take a look at how we can use those Esri apps and resources available to us on ArcGIS Online to manage our PCI (Pavement Condition Index) ratings on our road centerlines layer. The use of the Collector App will allow users to view the road centerline features in the field and which roads need inspected. The Survey123 App enables users to perform inspections to update their road PCI ratings, and Operations Dashboard is used to analyze those PCI ratings and make informed, detailed decisions on how to move forward with future construction projects to improve their roads. Combined, these ArcGIS Online applications make managing PCI ratings a breeze! Let’s take a deeper look into all the aspects of this PCI Inspection workflow.
Deploying & Configuring the Citizen Problem Reporter Solution

Of the many deploy able solutions that solutions that Esri offers, The Citizen Problem Reporter Solution is a Crowdsource Reporting Application that can be configured and leveraged for use across organizations. The solution (once deployed) allows the general public to submit non-emergency problems in the community based on problem categories (Animal Problems, Health Problems, Road Problems, etc.) and certain problem types within those categories (Barking or Loud Dog, Standing Water, Potholes, etc.). Like other Esri apps and solutions, the beauty of the Citizen Problem Reporter Solution is highly configurable- meaning it can be set-up to fit the specific requirements/inputs for each individual organizations. In this blog, we’ll take a look at how we’ve utilized this Esri solution here at Cloudpoint Geospatial!
Tying Together Survey123 and Collector with Related Records

Of the many applications that Esri has developed, Collector and Survey123 are two of the most common and widely deployed. They are both designed for field mobility, allowing users to collect, edit, and enter data from out in the field. Collector allows users to edit layers and enter data on mobile devices while on-site in the field, for example- collecting the location of culverts. What Survey123 allows users to do, is create and publish surveys referencing specific layers of data, for example- performing inspections on those previously mentioned culverts. To get the best of both worlds, why not incorporate those apps with each other so we can access Survey123 and submit surveys as inspection records from Collector? Well, this post will tell you how!
Extend a Hand: Symbolizing Related Data in ArcGIS Online is Within Reach

A very popular and enduring request of the ArcGIS Online user community has been to have the ability to symbolize features based on data that’s stored as a related record. Well, Esri has listened- and released in a June 2018 update to ArcGIS Online the ability to use related records data like never before. We now have the ability to symbolize and manipulate our data in ways that we previously limited.
ILGISA 2018 Review

Well Folks, sometimes busy is just too busy. While we are thankful for the work, We also want to keep you up to date with some of the things we have been doing. Below are a few random images from earlier this week when all the full-time staff attended the Illinois GIS Association annual conference in Lisle. Also, we wanted to have a location to post the presentations that Micah and Erin gave.
Create an Army of Data Collectors!

No one knows the features of an area like the people who inhabit it. However, to collect city or county wide data, there would be a sizable investment of personnel, time, and money. But what if it didn't have to cost an arm and a leg? What if you could create an army of data collectors who knew the area, and were willing to help document problems with features or infrastructure?
Using Esri's Story Maps to Map out Team USA!
Tracking your projects with Esri's Operations Dashboard For ArcGIS

Given the wide scope of work that GIS professionals complete, it's important for organizations to stay on top of the progress of various projects that are going on. No tool allows you to do this better than the Operations Dashboard application from Esri. The Operations Dashboard allows organizations the ability to monitor work, track field work crews, and view the status of tasks related to specific projects.
Going Native

We all know that our web maps and mapping applications we create can be accessed via mobile devices, and the interaction is actually fairly seamless and smooth. But say you want to go one step further, and actually create a native app that is available from the app store of your choice - or that feels like it was designed for your device - where do you start?
Easy & Quick NDVI Imagery for Small Areas with BIG Results

Our eyes don't see very much. Even less from far away. Technology has learned to augment our sight with sensors that can see other parts of the Electromagnetic Spectrum. This is especially important when it comes to plant health with NDVI. Part of the spectrum (Near Infrared) can actually visualize chlorophyll in plants. Cloudpoint is now happy to offer this service to our clients. One of our Certified UAS Pilots (we have 2) can fly a field, forest, golf course, subdivision or park and we can return a NDVI image of that area within 24 hours.
Dashboards - No Sweat

Most of us are familiar with this idea of dashboards. A quick overview of a set of data, system or project with supporting charts, dials or graphs that emphasize particular points about the data or view. There are some ESRI tools that have been around such as the Operations Dashboard, or the analysis-focused Insights. And now as of the June 2017 update, Web AppBuilder now has built-in functions for quickly creating configurable, informative dashboards on top of your web GIS.
Three New Technical Certifications

Cloudpoint Geographics Inc. is proud to announce that Paul Stephenson, Matt Junker and Micah Williamson have all recently been awarded Esri Technical Certification which recognizes superior skill levels utilizing Esri’s software for geographic information systems (GIS). Paul and Matt were awarded the ArcGIS Desktop Associate Certification. Micah was awarded the Enterprise System Design Associate...
But I have paper maps that work just fine...
Anyone who's following this blog has some awareness of GIS and what a powerful tool it can be. Throughout my various demonstrations or presentations, I am asked, "I have paper maps and CAD data, so why do I need GIS?" I usually respond with a standard set of answers: a GIS lets you edit information in real time, CAD is not to scale so your features aren't where you think they are, and so on.
A Few Reasons for Pro

A fresh calendar year is upon us, and one of my goals this round is to give ArcGIS Pro a legitimate shot at being the go-to desktop GIS application. (TBD...)
As increasingly more development goes into ArcGIS Pro, we as GIS professionals are beginning to actually consider the gradual shift away from ArcMap. Many of us have dabbled with Pro by now, and many of us have been more or less disappointed by either our machines’ lack of drawing performance or the program's lack of familiar places or functions.
Using Mobile GIS to Get Big Bucks

It's no secret to anyone who knows me, that when the temperature drops and the leaves start to change color, it's time to get into the woods. Chasing whitetail deer through various counties of Illinois is something that I long for and a passion that helps me rest and recharge the batteries of life. There is nothing that equals being able to silently enter the woods and have the wild slowly wake up around you. Hearing the first birds chirp in the soft morning light, followed by the crunching of leaves as two .....
Be kind. Rewind. Cloudpoint launches a Video Page!

How to show Flow Direction for pipe networks in ArcGIS Online
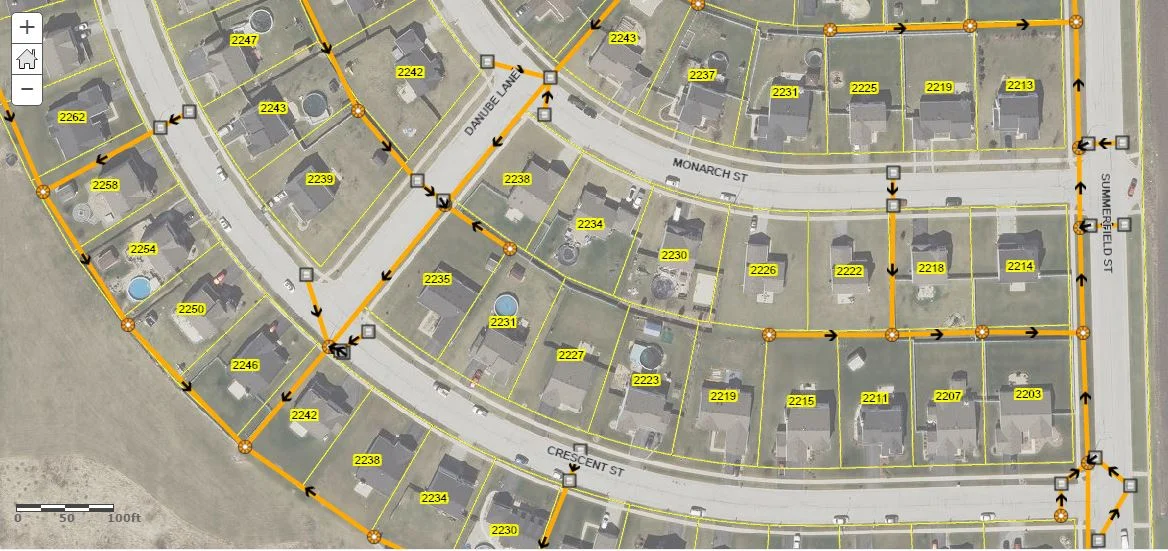
After a few years now of ArcGIS Online, there is still no support for non-simple line symbols. This means for utilities, or streams, routes or whatever line features you may be managing, you cannot easily display them with flow direction arrows as in Desktop. Please Note: Those with access to ArcGIS for Server can certainly publish map services that will support this type of symbology and can be displayed through ArcGIS Online. However there are probably many that do not have that option, so in this post I'll discuss a one method as a work-around to solve this...
Leaving a legacy: Preventing the loss of Tribal Data.

As employees accumulate years on the job, they begin to build up an internal database of information. A common term for this is Tribal Knowledge. Tribal knowledge is used to describe the wealth of data that a long time employee has developed, obsorbed, and retained over time. This is a fantastic resource for your organization which can....